Algorithms Overview
RNA library analysis
SeekSpace® Tools use the SeekSoul® Tools RNA module for the analysis of RNA libraries; specific algorithm descriptions can be found in SeekSoul® Tools.
R1 structure of spatial transcriptomic RNA library: 
Cell calling
In comparison to SeekSoul® Tools, SeekSpace® Tools using the “forceCell” method during cell calling. It extracts the UMI counts of the top 80,000 cells by default and uses a min_umi count of 200 as the threshold to calling out cells for generating filtered matrix.
Spatial positioning
Retrieval of spatial barcodes and associated coordinates
There are two types of libraries related to spatial positioning, the spatial library and the HDMI library.
Spatial library
R1 structure of spatial library is the same as RNA library. R2 structure is as follows:

For the R1 of spatial library, the cell barcode correction and UMI extraction are also performed using the rna module of SeekSoul® Tools. Subsequently, spatial barcodes are extracted from R2 to create correlations between cell barcodes and spatial barcodes. Unlike UMIs in the RNA library, UMIs in the spatial library represent the expression level of each spatial barcode on each cell.
The HDMI library is a single-end sequencing library where each read contains a 32-base spatial barcode, and each spatial barcode having corresponding positional information. We utilized the spatial barcodes extracted from the spatial library as a whitelist and run the rna module of SeekSoul® Tools to correct the spatial barcodes in the HDMI library, while also retrieve the coordinates of spatial barcodes.
Filtering
Some of the extracted spatial barcodes from spatial library may be invalid. These invalid barcodes could result from the inclusion of shorter mRNA fragments from the RNA library. Since these fragments are not present in the HDMI library, coordinates cannot be provided. Apart from the factor mentioned above, sequencing errors can also lead to invalid barcodes. To ensure accuracy, we exclude these invalid spatial barcodes from the analysis.
In the HDMI library, some spatial barcodes may appear multiple times with different coordinates. Since we cannot determine the exact spatial positions of these spatial barcodes, they will be filtered out.
For certain spatial barcodes, we observed an unusually high level of UMI support. We think this might be because these spatial barcodes detached from the chip during the experiment and get in droplets. These particular spatial barcodes are considered inaccurate. To filter out these erroneous spatial barcodes, we took the following steps
Dividing the chip into bins of size 30x30.
Counting total number of UMI support for spatial barcodes in each bin.
Sorting bins in descending order of UMI supports.
Calculating threshold based on the distribution of sorted bins.
If the UMI support of a bin exceeds the threshold, we remove all spatial barcodes corresponding to the cell barcode with the highest UMI support in that bin.
Finally, we filtered out all cell barcodes that are not cells during cell calling and their corresponding spatial barcodes, only positioning cells with biological significance.
Cell position determination
When determining the center position of a cell, we must take into account the existence of noisy spatial barcodes. These spatial barcodes may exist as background in droplets during the experiment or marked on nuclear fragments, leading to multiple positions on the chip. Therefore, we need to filter out cells with multiple centers to ensure that cells with clearly defined center are retained.
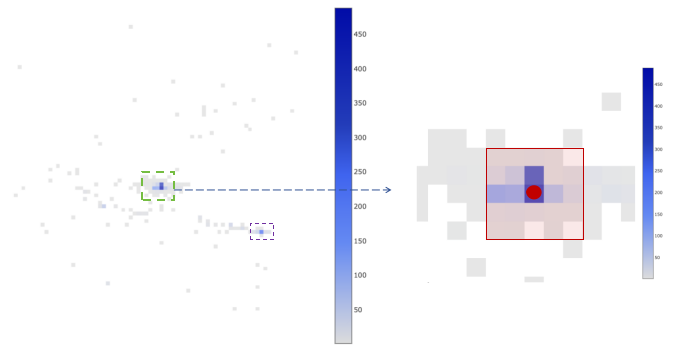
Spatial barcode distribution of a cell is displayed on the left. Each grid represents a bin. The size of each bin is about 100 pixels. Each side equivalent to 26.5 micrometers. The color of each bin represents the level of UMI support of the spatial barcode in that bin, and the deeper the color, the higher the UMIs.
The figure on the right is a magnified view of the image within the green box in the left figure. The bin where the red dot is located represents the bin with the highest UMI support of the cell, which is defined as the center of the cell. The center bin and the 24 bins around center, which are included in the red box, is defined as the core of the cell. To determine whether the cell has multiple centers, we need to find the secondary center. The secondary center is defined as the bin with the highest UMI support that is not in the core. We calculate the ratio of the total UMI number in the core to the total UMI number in the secondary center and 24 surrounding bins. If the ratio is greater than or equal to 2, we considered the cell has an unique center. For other cells, we think they have multiple centers and exclude these cells.
Finally, we can determine the position of the cell using the spatial barcode distribution in the core.
After the processing procedures described above, the following indicators are available:
Total Spatial Reads: The number of reads in the spatial library, indicating the total number of reads after the sequencing procedure.
Valid Spatial Reads: The number of valid spatial reads, which refers to the number of reads with R1 barcode that do not need to be corrected or corrected successfully, and R2 with at least 32 bps in length.
Total Spatial UMIs: The total number of spatial UMIs, indicating the number of UMIs when Cell barcodes, UMIs, and spatial barcodes are extracted and deduplicated from valid spatial reads.
Spatial Barcode Saturation: The spatial library saturation. 1 - Total Spatial UMIs/Valid Spatial Reads
Valid Spatial UMIs: The number of valid spatial UMIs, which refers to the number of UMIs supported by the remaining spatial barcodes after excluding invalid spatial barcodes
Spatial UMIs with Unique Locations: The proportion of UMIs supported by spatial barcode with unique location to the valid spatial UMIs
Accurate Spatial UMIs: The proportion of UMIs supported by accurate spatial barcodes to the valid spatial UMIs
Accurate Spatial UMI Bins: The proportion of bins with accurate spatial barcodes to the total number of bins
Cell-Identified Spatial UMIs: Spatial UMIs associated with cells. The proportion of UMIs supported by cell barcode identified as cells to the accurate spatial UMIs
Mean Spatial UMIs per Cell: The average number of spatial UMIs per cell, which is the number of spatial UMIs associated with cells divided by the number of identified cells
Tissue Detection
SeekSapce® Tools are able to identify tissue and extracts cells under tissue coverage for subsequent analysis. It can received DAPI stained images and H&E stained images after image registration. The input image is scaled and smoothed, and image processing algorithms in OpenCV are used to separate tissue from background. Throughout the process, the aspect ratio of the image remains consistent with the original image.
If the tissue and the cell region do not overlap completely, SeekSpace® Tools provides a manual alignment toolkit. By using the manual alignment toolkit, the tissue image can be uniformly scaled, translated, and rotated. Alignment parameters can be downloaded, and then re-entered into SeekSpace® Tools to generate a new tissue image to ensure accurate correspondence between the tissue image and the cell region.
Subsequent analysis
After we got filtered matrix of cells under the tissue, we can proceed to downstream analysis.
Seurat analysis
SeekSpace® Tools use Seurat to calculate the mitochondrial content, number of genes, and UMIs of each cell. After that, the gene expression matrix is normalized, and a subset of features that exhibit high cell-to-cell variation in the dataset is identified. Linear dimensional reduction using PCA is then performed, and the result is passed to t-SNE and UMAP for visualization. A graph-based clustering procedure is then followed, and cells are partitioned into different clusters. Finally, SeekSpace® Tools finds markers that define clusters via differential expression.